
High-Level Dashboard & Key Metrics
The High-Level Dashboard (accessible via the Overview tab) serves as the executive summary and health control center for your test suite execution. It transforms thousands of raw assertion points into clear, actionable KPI indicators.
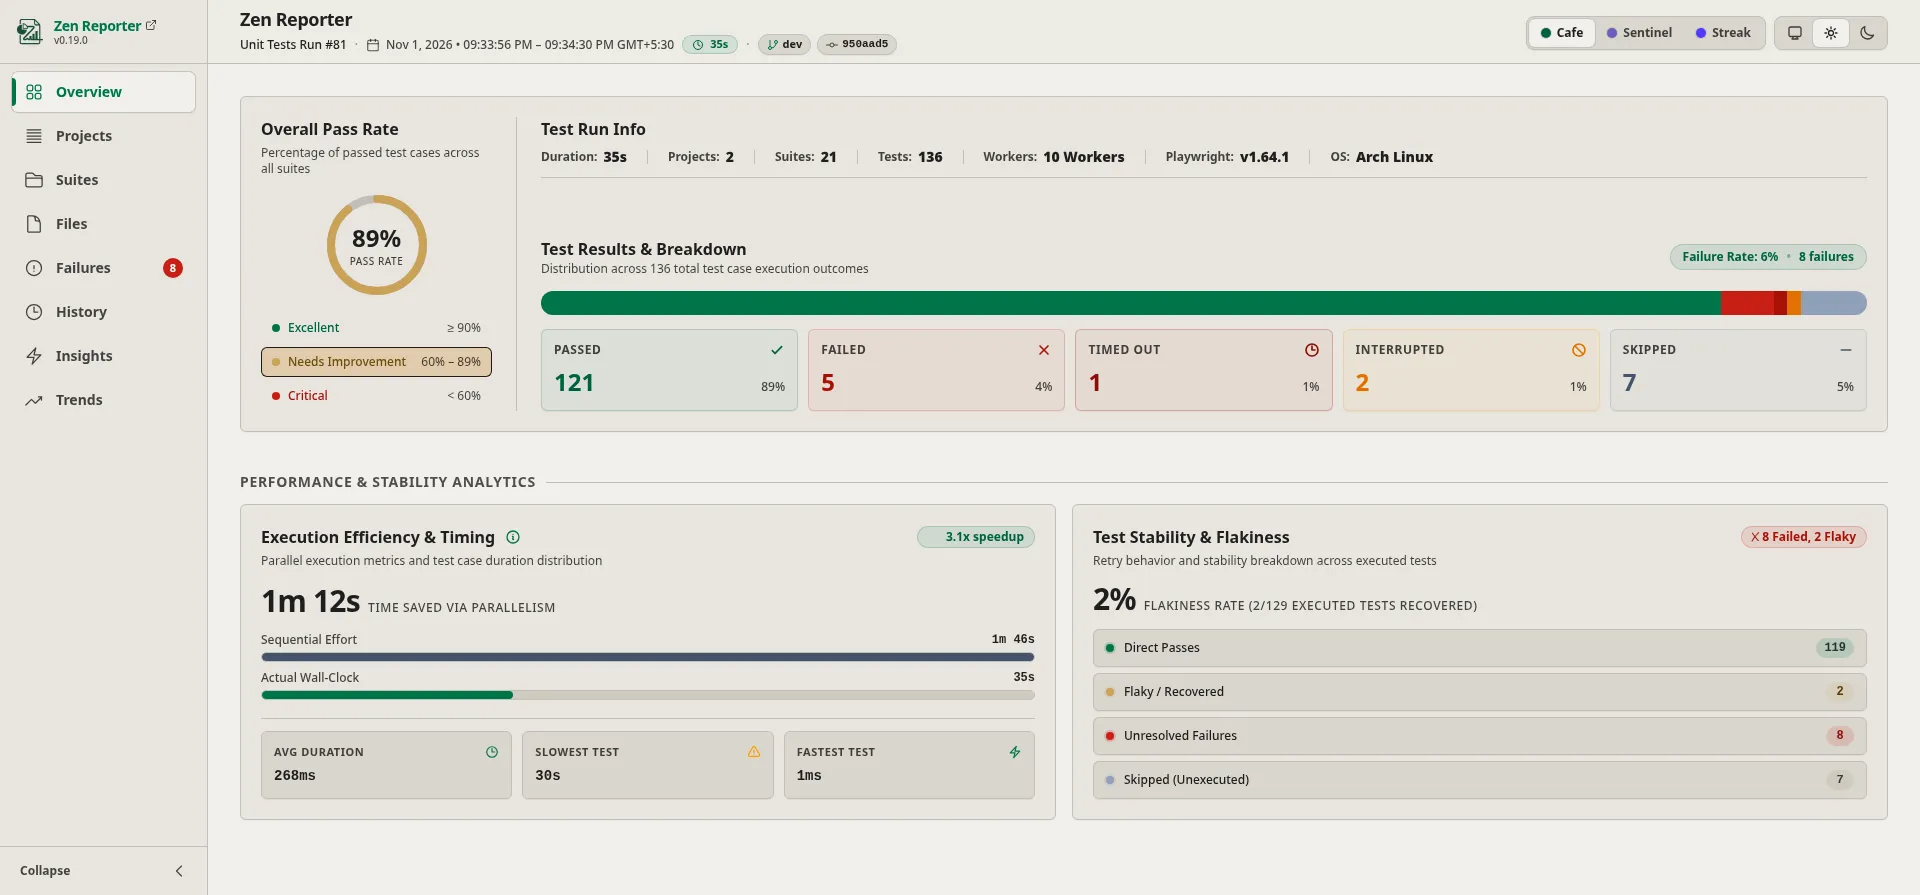
🔍 Key Dashboard Sections & Metrics
Section titled “🔍 Key Dashboard Sections & Metrics”1. Header & Navigation Context
Section titled “1. Header & Navigation Context”The top bar and run header display key execution context:
- Test Run Title & Run Number: Indicates the test run suite and execution ID (e.g.,
Unit Tests Run #145). - Timestamp & Duration Pill: Shows execution date, start/end timestamps with timezone, and total execution duration (e.g.,
31s). - Theme & Mode Selectors: Quick switches for dashboard themes and light/dark mode selection.
2. High-Level Execution Summary
Section titled “2. High-Level Execution Summary”The top section provides an immediate health check and high-level breakdown of the run:
Overall Pass Rate
Section titled “Overall Pass Rate”- Radial Pass Rate Gauge: Prominent circular donut chart displaying the suite’s overall pass rate percentage (e.g.,
83% PASS RATE). - Health Tier Thresholds / Legend:
- 🟢 Excellent (≥ 90%): High suite stability.
- 🟡 Needs Improvement (60% – 89%): Moderate failure rates requiring attention.
- 🔴 Critical (< 60%): Severe failure state requiring immediate triage.
Test Run Info
Section titled “Test Run Info”A concise summary card displaying key environment and scope metrics:
- Duration: Total wall-clock time (e.g.,
31s). - Projects: Total number of configured projects/browsers (e.g.,
2). - Suites: Total number of suites/spec files (e.g.,
12). - Tests: Total test cases evaluated (e.g.,
70). - Workers: Number of parallel worker threads allocated (e.g.,
10 Workers). - Playwright: Playwright version used for the test run (e.g.,
v1.64.1), when available. - OS: Host operating system name (e.g.,
Arch Linux,macOS), when available.
Test Results & Breakdown
Section titled “Test Results & Breakdown”- Distribution Stacked Progress Bar: A horizontal proportional bar representing the distribution across all execution outcomes, accompanied by a summary badge (e.g.,
Failure Rate: 12% • 8 failures). - Outcome Status Cards: Distinct status cards with counts, percentage shares, and status icons:
- 🟢 PASSED: Count and percentage of successful tests (e.g.,
58|83%). - 🔴 FAILED: Count and percentage of assertion or runtime failures (e.g.,
4|6%). - 🟣 TIMED OUT: Count and percentage of tests exceeding timeouts (e.g.,
2|3%). - 🟠 INTERRUPTED: Count and percentage of abruptly terminated or aborted tests (e.g.,
2|3%). - 🟡 SKIPPED: Count and percentage of intentionally skipped test cases (e.g.,
4|5%).
- 🟢 PASSED: Count and percentage of successful tests (e.g.,
3. Performance & Stability Analytics
Section titled “3. Performance & Stability Analytics”A dedicated analytics section divided into two main panels:
Execution Efficiency & Timing
Section titled “Execution Efficiency & Timing”Measures parallel execution performance and timing metrics:
- Header Badges: Includes tooltip information and a speedup factor pill (e.g.,
2.2x speedup). - Time Saved Via Parallelism: Highlights the net time saved by running tests concurrently across workers (e.g.,
37s TIME SAVED VIA PARALLELISM). - Sequential Effort vs. Actual Wall-Clock: Comparative progress bars illustrating:
- Sequential Effort: Cumulative execution duration if run sequentially (e.g.,
1m 9s). - Actual Wall-Clock: Total real time elapsed (e.g.,
31s).
- Sequential Effort: Cumulative execution duration if run sequentially (e.g.,
- Timing Benchmarks:
- AVG DURATION: Average test duration across all tests (e.g.,
475ms). - SLOWEST TEST: Duration of the slowest test case in the run (e.g.,
30s). - FASTEST TEST: Duration of the fastest test case (e.g.,
1ms).
- AVG DURATION: Average test duration across all tests (e.g.,
Test Stability & Flakiness
Section titled “Test Stability & Flakiness”Analyzes retry behavior and stability across executed tests:
- Flakiness Rate Metric: Prominent percentage indicator highlighting recovered test cases relative to total executed tests (e.g.,
3% FLAKINESS RATE (2/66 EXECUTED TESTS RECOVERED)). - Issue Summary Badge: Header pill summarizing failures and flaky tests (e.g.,
✕ 8 Failed, 2 Flaky). - Stability Breakdown:
- 🟢 Direct Passes: Tests passing on initial execution without retries.
- 🟡 Flaky / Recovered: Tests that failed initially but succeeded after retry.
- 🔴 Unresolved Failures: Tests that failed even after retry attempts.
- ⚪ Skipped (Unexecuted): Bypassed or unexecuted test cases.
💡 How to Use the Dashboard
Section titled “💡 How to Use the Dashboard”- Daily CI Monitoring: Check the Overall Pass Rate and Test Results & Breakdown cards for immediate build health.
- Parallelism & Performance Tuning: Review Execution Efficiency & Timing to measure the impact of adjusting worker threads in your configuration.
- Flakiness Triage: Check Test Stability & Flakiness to spot unreliable tests that recover on retry before they become permanent failures.